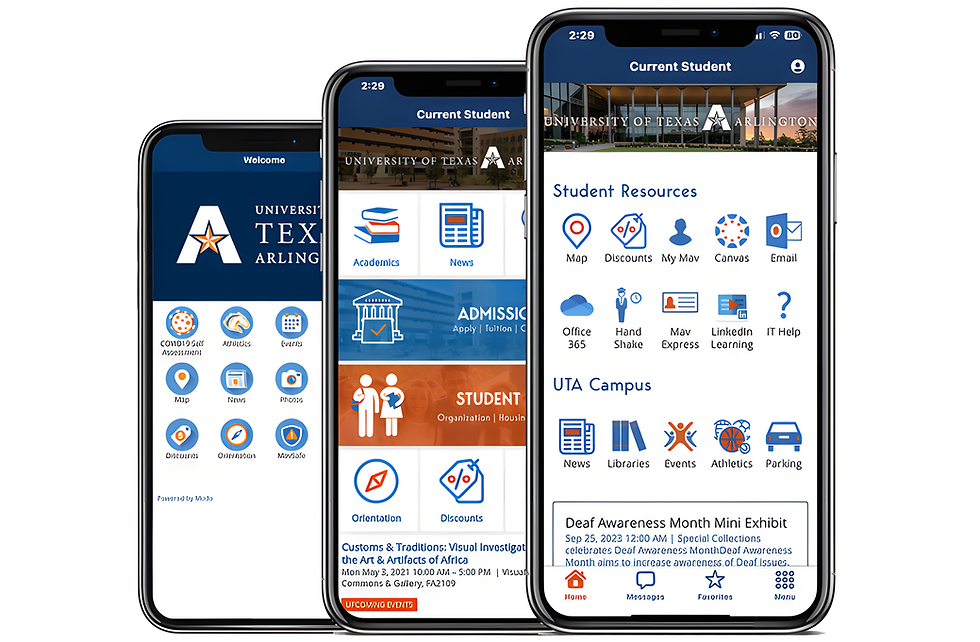
MyMav - Prototype of University Application
MyMav UTA University App 0-1
Role : UX/UI Designer
UI/UX Design - Information Architecture - Design Concepts - Design Flows - Storyboarding - Design System
_upscayl_4x_upscayl-standard-4x.png)
Challenge
Each year, a significant number of non-local students enroll, encountering challenges in navigating and staying informed about campus happenings.
Common grievances include missing events and struggling with internal transportation.


Research
Research Findings:
-
Interview Students on campus Explore students’ view on culture as well as how it impacts their way of networking and life at MyMAV.
-
Exploring To better understand the users and their Challenges at UTA.
-
To learn about their difficulties due to cultural differences.
-
Lifestyle Understand the emotions around networking- the introverts user group in particular
Insights:
-
Takeaways based on 38 Interviews I always miss events that happen on campus UTA is beautiful, always wanted to explore college, but i don’t think i have seen half of it.


Design
-
Target Users Prioritizing individuals with family obligations and with demanding solo lifestyles.
-
Adults that range from young professionals to seniors, each with unique lifestyle demands.
-
Special attention is given to older users, ensuring comfort and minimal physical strain in their interactions.
-
Ideas based on research findings Users’ Interaction with the Platform - Final Design


_edited_edited.png)
Wireframing
Low-Fidelity Wireframes
I started with sketches and grayscale to focus on layout and hierarchy.
-
Sidebar nav with persistent icons.
-
Modular cards for occupancy, revenue, maintenance alerts.
Mid-Fidelity Prototype (Tested with 5 Users)
Using Maze, we conducted unmoderated tests on task flows:
-
Add new interface
-
Check occupancy trends
Success Rate: 92%
Avg. Completion Time: Improved by 38% from legacy design

Prototyping
A modern UI with a neutral color palette, clear iconography, and semantic color use for accessibility.
Key UI Elements:
-
Sidebar Navigation: Collapsible, icon-labeled, intuitive categories.
-
Dashboard Cards: Highlight KPIs like occupancy rate, revenue, maintenance tickets.
-
Dynamic Graphs: Filterable by time, location, and type.

-portrait.png)

25% increase in Engagement in Events
in Just one week
Great feedback from help desks, way less inquiries
Increase engagement in Cultural center
Parking Integration saves time by 15 mins
Conclusion
-
Complex dashboards require ruthless prioritization in layout and features.
-
Real-world feedback > design assumptions.
-
Small UI improvements (like icon labels or card layouts) can make massive usability differences.
-
Designing for accessibility isn't optional—especially in enterprise tools.
WELCOME WELCOME MORE WORK MORE WORK MORE WORK MORE WORK MORE WORK MORE WORK MORE WORK MORE WORK MORE WORK MORE WORK MORE WORK MORE WORK MORE WORK MORE WORK MORE WORK MORE WORK MORE WORK MORE WORK MORE WORK MORE WORK MORE WORK WELCOME

